The world of the future is not the world of capitalism, it’s the world of ‘talentism.’
— Read on www.forbes.com/sites/joemckendrick/2021/01/29/the-great-digital-reset-chasing-talent-not-capital/
Digitalization did not increase productivity as expected
Digitalization did not increase productivity as expected
— Read on phys.org/news/2021-01-digitalization-productivity.html
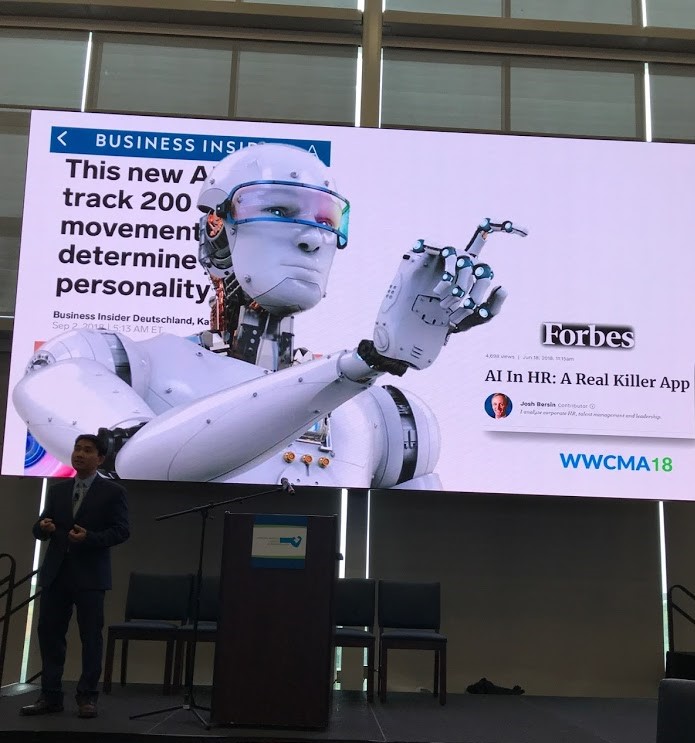
Credit: Aalto University
Big data, the Internet of Things (IoT), the Industrial Internet and Industry 4.0 and later, 5G and artificial intelligence were presented as drivers of productivity, and experts predicted that the productivity of industry and services will increase significantly thanks to digitalisation. For example, Accenture predicted that artificial intelligence alone would provide an annual 2% rise in value added potential in Finland.
In reality, huge sector-specific differences are seen in growth leaps.
“Although the productivity of work in Finnish industry has improved by 22 percent over the past decade, the increase in the production of machinery and equipment has been just 4 percent in ten years and 8 percent in construction,” says Research Professor Heikki Ailisto from VTT Technical Research Centre of Finland. On the other hand, productivity has increased in the information and communication sectors by 38% and in the financial and insurance sector by 35%. The differences between companies in the same sector are also extensive.
The productivity benefits of digitalisation vary dramatically by sector
The Digital Disruption of Industry Consortium has researched the impact of digitalisation on Finnish society. Researchers found that the differences in productivity within sectors can be explained as follows:
The information, communication and financial sector are pioneers in the utilization of digitalisation that have been able to increase their productivity. International studies confirm the view that these differences are due to the ability of different sectors to utilize digitalisation: Banking operations are easier to digitalise than a construction site. A report published by the OECD classifies the information and financing sectors are those that are furthest in overall digitalisation. The utilization of digitalisation is also essential for the competitiveness of companies in these sectors, as the sectors are also subject to international competition and their competitors utilize digitalisation.
As a whole, construction and the manufacture of machinery and equipment are not at the forefront of digitalisation, even though many companies have already done a great deal in this respect. In its report, the OECD classifies construction as a low-digitalisation sector. Construction is a typical domestic sector in which international competition does not create any pressure to increase efficiency. Labor costs in the labor-intensive construction sector have been influenced by the entry of cheap foreign labor into the market, which has reduced the pressure to develop productivity.
Although the manufacturing industry has engaged in automation for numerous decades and in the 2010s, the Industrial Internet and investments in Industry 4.0 were expected to significantly improve productivity, the sector is no more than average in digitalisation, according to assessments by the OECD and McKinsey.
Productivity development will determine Finland’s future well-being
Increasing the amount of work done in society, for example, by increasing the employment rate or immigration, will certainly increase the GDP. However, growth in the employment rate will likely occur in low-productivity sectors and may even require government subsidies, for example in the form of wage subsidies. In other words, the net impact on central government revenue will be small or, at worst, negative.
The development of Finland’s well-being and Finland’s prosperity will depend on the ability of industry and other sectors to get the same amount of work done with less labor, especially as the population ages. For this reason, increasing the productivity of work is a necessity. Productivity increases by increasing the value of production, i.e. the value of a product or service, or by improving production efficiency. Digitalisation can have an impact on both. The value of the product to the customer may increase, for example, by integrating services produced with digitalisation into the product. On the other hand, the increase of efficiency is often achieved by integrating digitalisation into the production process to streamline it or by automating routines.
“The time is now ripe for the digitalisation of the manufacturing industry and construction, and through this for increasing productivity,” says Professor of Practice Timo Seppälä from Aalto University.
Researchers recommend that decision-makers undertake the following measures to increase productivity:
Analyze projects financed with public funds that have aimed at promoting digitalisation from the perspective of productivity development. The Government’s analysis, assessment and research activities are a good means for the implementation of an impartial analysis.
The launch of development and research projects that will aim at an increase in efficiency in manufacturing industry and the construction sector through digitalisation utilizing the lessons learned from the analyses completed by means of the first recommendation.
Develop digital features and services that increase the value of products in research and development projects to increase the value of manufacturing and construction products.
As digitalisation requires new skills, in particular continuing education that will focus on teaching digitalisation and skills for the use, application and implementation of new technologies also to those already in working life.
Health IT execs offer thoughts on the big issues of 2021 | Healthcare IT News
Where are vaccine supply chains, value-based care, AI, telehealth and other trends headed next year? C-suite leaders from an array of vendors weigh in on provider/payer relations, the healthcare workforce and more.
— Read on www.healthcareitnews.com/news/health-it-execs-offer-thoughts-big-issues-2021
2021 could be the year automation and AI truly accelerate the economy – Axios
Productivity growth has been stagnant for years, but new technologies are finally set to change that.
— Read on www.axios.com/productivity-growth-j-curve-automation-ai-23bf33a3-ebf9-4407-9668-006db8984497.html
Bryan Walsh – Technology
The coronavirus pandemic hit the global economy hard in 2020, but the economy may be close to consolidating years of technological advances — and ready to take off in a burst of productivity growth.
Why it matters: Productivity is the engine that makes the economy grow for everyone. If long-gestating technologies like AI and automation really are ready to fulfill their potential, we’ll have the chance to escape the great stagnation that has choked our economy and poisoned our politics.
What’s happening: Hidden in part by the human and economic suffering of the pandemic, 2020 saw a collection of remarkable technological breakthroughs, including a mRNA vaccine for COVID-19 and advances in AI language generation.
Context: In a blog post published last month, the economist Tyler Cowen added in a few others, including affordable solar power and remote work, and asked whether total factor productivity (TFP) — a rough approximation of the effect technological and strategic progress has on economic productivity — in 2021 “will be remarkably high, maybe the highest ever?”
• Cowen’s musings matter because he literally wrote the book on “the great stagnation” — his term for the curious and persistent slowdown in wage and productivity growth in the U.S. over the past few decades, even as the internet and everything that grew out of it seemed to transform life as we knew it.
Flashback: After a few postwar decades of scorching growth, labor productivity began to decelerate sharply in the 1970s, and aside from a period of 3% growth in the mid-1990s to early 2000s — which economists attributed to the widespread effects of the computer — it’s stayed mired at about 1.2% a year ever since .
• Some experts have argued that conventional economic metrics fail to fully measure the productivity benefits of newer technologies like social media and the internet, but even so, they don’t compare to the advances of the past, like widespread electrification and antibiotics.
It looks increasingly possible that the last decade plus of sluggish productivity growth isn’t a sign that the benefits of new technology have permanently plateaued, but that businesses were using the time to invest in and adjust to those new advances — and that we may now be ready to reap the benefits.
• Economists like Erik Byrnjolfsson have argued that we’re experiencing a “productivity J-curve.”
• When powerful new technologies are introduced into the economy, productivity may flatten or even dip a bit as initial investments are made — the first part of the J. But once those technologies have been fully digested, productivity can swoop upwards — the second part of the J.
• That’s what we’ve seen in the past. Computers began to filter into the workplace in the 1970s and 80s, but it wasn’t until the 1990s that the productivity gains of all those PCs were finally felt.
What they’re saying: “Often times in the short term it can be costly to invest in new business processes and skills, and during that time you won’t see productivity rising,” Byrnjolfsson told me earlier this year.
• “But in the years after you’ll see the upwards part of the J, and COVID-19 has catalyzed the energy and creativity around this process.”
By the numbers: A survey by the World Economic Forum in October found more than 80% of global firms plan to accelerate the digitization of business process and grow remote work, while half plan to accelerate automation.
• About 43% expect those changes to reduce their workforces overall, which implies an expected increase in productivity.
The catch: If those gains don’t filter down to workers — or worse, end up eliminating jobs without replacing them with better ones — even a faster, more productive economy won’t ameliorate the inequality-driven political divisions that have dogged the U.S. in recent years.
The bottom line: As bad as 2020 has been, we may look back upon it as the year that finished the launchpad for a new Roaring ’20s.
7 things about EHRs that stress out doctors | American Medical Association
Learn about what research has identified as the factors of electronic health record (EHR) systems associated with physician stress and burnout.
— Read on www.ama-assn.org/practice-management/digital/7-things-about-ehrs-stress-out-doctors
Ambient documentation with Epic helps reduce clinician burnout at Monument Health | Healthcare IT News
The goal of its Nuance deployment is to significantly reduce after-hours “pajama time” charting while introducing the voice of the patient to the EHR, says its CIO and CMIO.
— Read on www.healthcareitnews.com/news/ambient-documentation-epic-helps-reduce-clinician-burnout-monument-health
Scientists Figured Out How Much Exercise You Need to ‘Offset’ a Day of Sitting
We know that spending hour after hour sitting down isn’t good for us, but just how much exercise is needed to counteract the negative health impact of a day at a desk? A new study suggests about 30-40 minutes per day of building up a sweat should d
— Read on www.sciencealert.com/getting-a-sweat-on-for-30-40-minutes-could-offset-a-day-of-sitting-down
Scientists Figured Out How Much Exercise You Need to ‘Offset’ a Day of Sitting
We know that spending hour after hour sitting down isn’t good for us, but just how much exercise is needed to counteract the negative health impact of a day at a desk? A new study suggests about 30-40 minutes per day of building up a sweat should do it.
Up to 40 minutes of “moderate to vigorous intensity physical activity” every day is about the right amount to balance out 10 hours of sitting still, the research says – although any amount of exercise or even just standing up helps to some extent.
That’s based on a meta-analysis across nine previous studies, involving a total of 44,370 people in four different countries who were wearing some form of fitness tracker.
The analysis found the risk of death among those with a more sedentary lifestyle went up as time spent engaging in moderate-to-vigorous intensity physical activity went down.
“In active individuals doing about 30-40 minutes of moderate to vigorous intensity physical activity, the association between high sedentary time and risk of death is not significantly different from those with low amounts of sedentary time,” write the researchers in their published paper.
In other words, putting in some reasonably intensive activities – cycling, brisk walking, gardening – can lower your risk of an earlier death right back down to what it would be if you weren’t doing all that sitting around, to the extent that this link can be seen in the amassed data of many thousands of people.
While meta-analyses like this one always require some elaborate dot-joining across separate studies with different volunteers, timescales, and conditions, the benefit of this particular piece of research is that it relied on relatively objective data from wearables – not data self-reported by the participants.
The study arrives alongside the publication of the World Health Organization 2020 Global Guidelines on Physical Activity and Sedentary Behaviour, put together by 40 scientists across six continents. The British Journal of Sports Medicine (BHSM) has put out a special edition to carry both the new study and the new guidelines.
“These guidelines are very timely, given that we are in the middle of a global pandemic, which has confined people indoors for long periods and encouraged an increase in sedentary behaviour,” says physical activity and population health researcher Emmanuel Stamatakis from the University of Sydney in Australia.
“People can still protect their health and offset the harmful effects of physical inactivity,” says Stamatakis, who wasn’t involved in the meta-analysis but is the co-editor of the BJSM. “As these guidelines emphasise, all physical activity counts and any amount of it is better than none.”
The research based on fitness trackers is broadly in line with the new WHO guidelines, which recommend 150-300 mins of moderate intensity or 75-150 mins of vigorous intensity physical activity every week to counter sedentary behaviour.
Walking up the stairs instead of taking the lift, playing with children and pets, taking part in yoga or dancing, doing household chores, walking, and cycling are all put forward as ways in which people can be more active – and if you can’t manage the 30-40 minutes right away, the researchers say, start off small.
Making recommendations across all ages and body types is tricky, though the 40 minute time frame for activity fits in with previous research. As more data gets published, we should learn more about how to stay healthy even if we have to spend extended periods of time at a desk.
“Although the new guidelines reflect the best available science, there are still some gaps in our knowledge,” says Stamatakis. “We are still not clear, for example, where exactly the bar for ‘too much sitting’ is. But this is a fast-paced field of research, and we will hopefully have answers in a few years’ time.”
The research has been published here, and the new guidelines here, in the British Journal of Sports Medicine.
Breaking classroom barriers over Zoom
When Professor Lori Rosenkopf’s course on the culture of tech went virtual, she set out to make a more interactive learning experience. Her efforts have seen some unexpected results.
— Read on penntoday.upenn.edu/news/breaking-classroom-barriers-over-zoom
Mobility network models of COVID-19 explain inequities and inform reopening
Based on cellular mobility data,
Researchers from Stanford University, among other institutions, studied anonymized data on 98 million people and their movement patterns hour-by-hour in the 10 largest metro areas in the U.S. An early version of the peer-reviewed findings was published on Tuesday in the journal Nature.
“We found large variation in predicted reopening risks: on average across metro areas, full-service restaurants, gyms, hotels, cafes, religious organizations, and limited-service restaurants produced the largest predicted increases in infections when reopened,” study authors wrote.
The COVID-19 pandemic dramatically changed human mobility patterns, necessitating epidemiological models which capture the effects of changes in mobility on virus spread1. We introduce a metapopulation SEIR model that integrates fine-grained, dynamic mobility networks to simulate the spread of SARS-CoV-2 in 10 of the largest US metropolitan statistical areas. Derived from cell phone data, our mobility networks map the hourly movements of 98 million people from neighborhoods (census block groups, or CBGs) to points of interest (POIs) such as restaurants and religious establishments, connecting 57k CBGs to 553k POIs with 5.4 billion hourly edges. We show that by integrating these networks, a relatively simple SEIR model can accurately fit the real case trajectory, despite substantial changes in population behavior over time. Our model predicts that a small minority of “superspreader” POIs account for a large majority of infections and that restricting maximum occupancy at each POI is more effective than uniformly reducing mobility. Our model also correctly predicts higher infection rates among disadvantaged racial and socioeconomic groups2–8 solely from differences in mobility: we find that disadvantaged groups have not been able to reduce mobility as sharply, and that the POIs they visit are more crowded and therefore higher-risk. By capturing who is infected at which locations, our model supports detailed analyses that can inform more effective and equitable policy responses to COVID-19.
— Read on www.nature.com/articles/s41586-020-2923-3
Is Text-Based Therapy Effective?
What to know about the benefits and limitations of AI-operated chatbots
— Read on lifehacker.com/is-text-based-therapy-effective-1845593661